Unlocking Speed: The Ultimate Guide to Sim Racing Telemetry Analysis
ultimate-guide-sim-racing-telemetry-analysis
Unlocking Speed: The Ultimate Guide to Sim Racing Telemetry Analysis
In the competitive world of sim racing, the difference between a podium finish and the middle of the pack often comes down to tenths of a second. While natural talent plays a role, the most consistent drivers rely on data to refine their performance. Understanding how to interpret your driving through telemetry is the most effective way to identify mistakes and find time on the track.
The Fundamentals of Telemetry Analysis
Telemetry is the digital footprint of your car’s performance and your inputs as a driver. By reviewing this data, you can see exactly what the car was doing at any given point on the circuit.
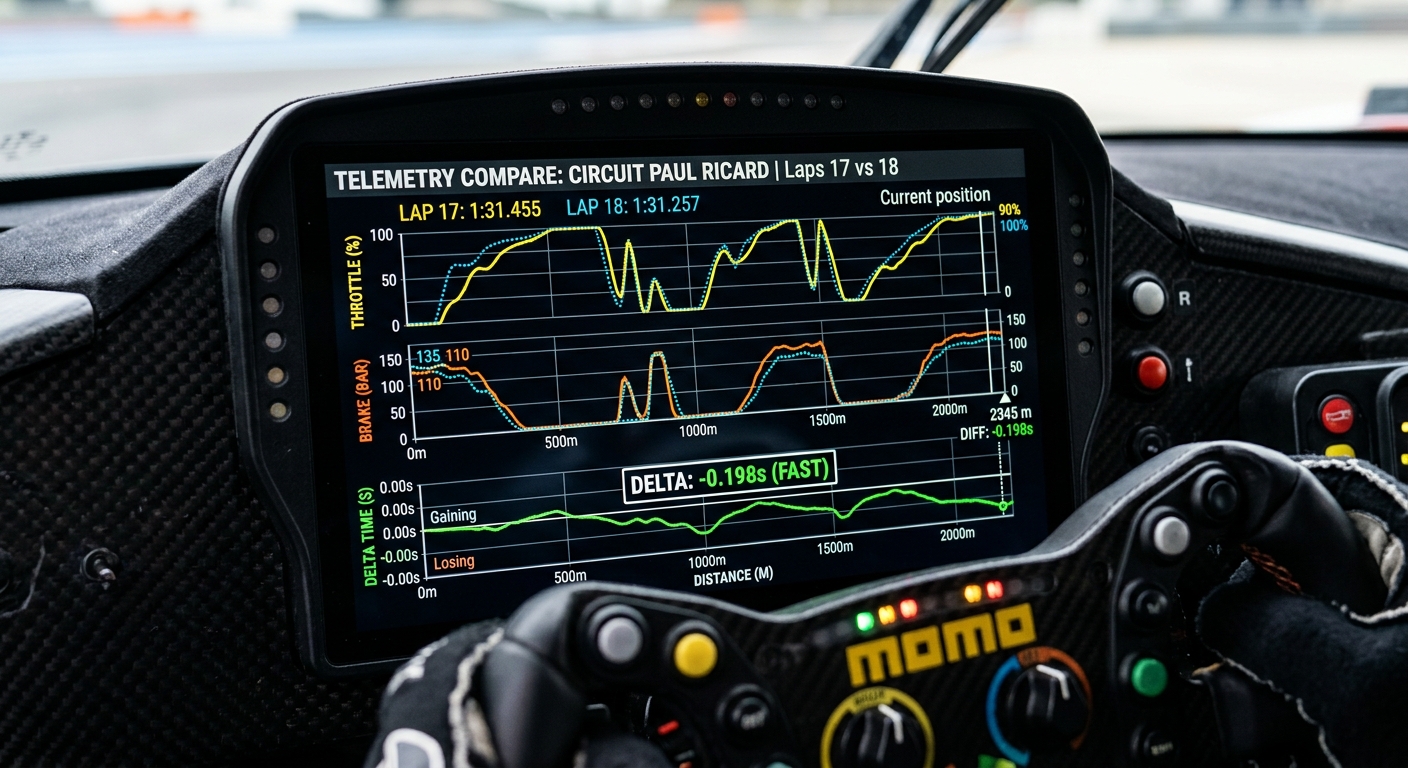
Braking Efficiency and Trail Braking
One of the most common areas where time is lost is during the braking phase. Telemetry allows you to visualize your brake pressure. Are you hitting peak pressure too late? Are you releasing the brake too abruptly and upsetting the car’s balance? Mastering trail braking—the art of gradually releasing the brake as you turn into a corner—is often revealed through the 'slope' of your brake graph.
Throttle Application and Corner Exit
Exiting a corner with maximum traction is critical for straight-line speed. By analyzing throttle traces, you can identify 'pumping' (on-and-off throttle) which indicates an unstable car or a lack of driver confidence. Ideally, you want a smooth, progressive application of power that reaches 100% as early as possible without inducing wheelspin.
Comparing Your Laps to the Pros
The fastest way to improve is by comparing your data against a 'reference lap' or a ghost lap from a faster driver.
- The Delta Bar: This shows you exactly where you are gaining or losing time in real-time.
- Speed Overlays: Comparing your minimum corner speeds (Apex speed) against a pro driver can highlight if you are over-slowing the car on entry.
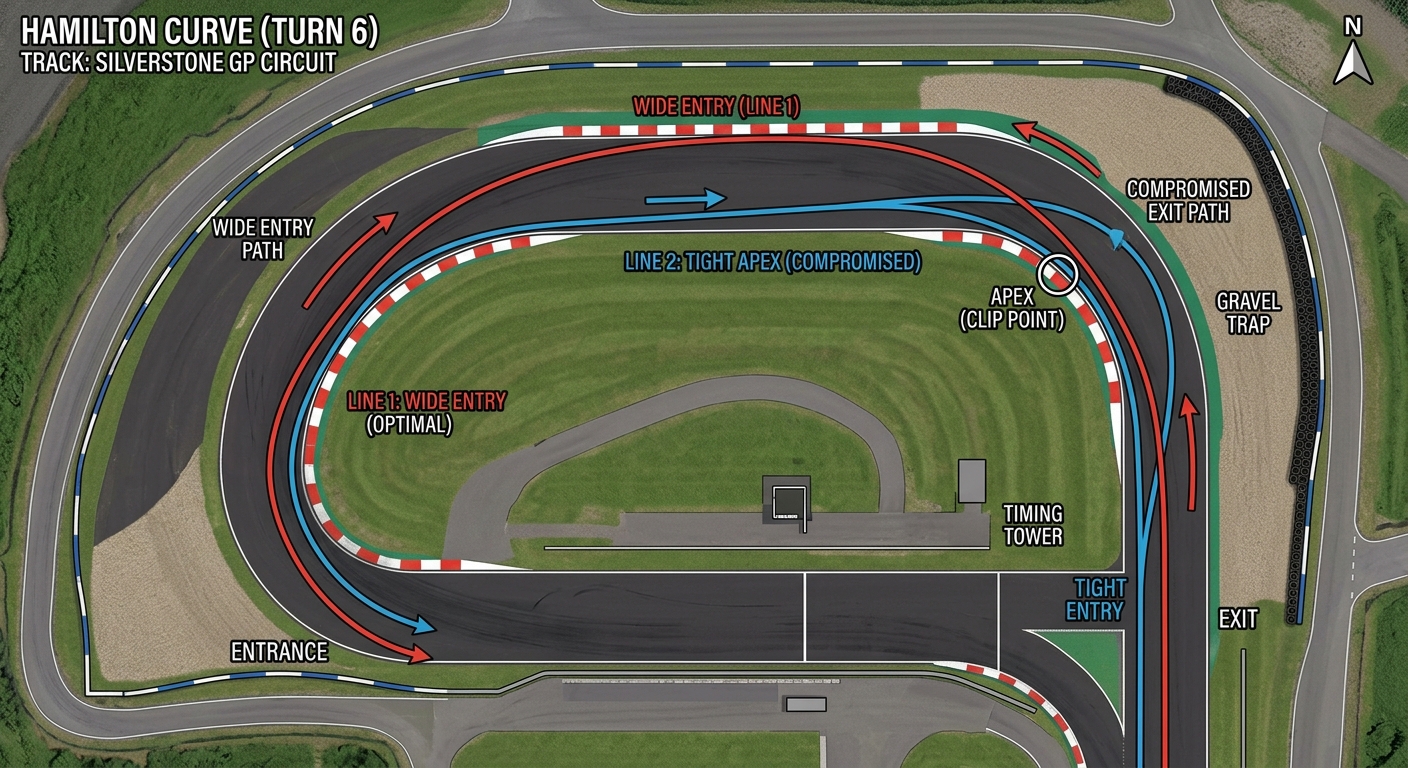
- Line Analysis: GPS maps in data software show if you are missing apexes or taking a sub-optimal wide line that adds unnecessary distance to your lap.
Improving Consistency with RaceData AI
Modern tools have made data analysis more accessible than ever. Utilizing platforms like RaceData AI allows drivers to quickly visualize complex telemetry without needing a degree in data engineering. By narrowing the focus to key performance indicators (KPIs) like steering angle and longitudinal G-forces, drivers can make iterative changes to their driving style that result in permanent pace improvements.
Advanced Setup Tweaks Based on Data
Beyond driving style, telemetry is the primary tool for fine-tuning your car's setup.
- Ride Heights: Monitor if the car is 'bottoming out' on bumps or under heavy aero load.
- Tire Temperatures: Analyze the inner, middle, and outer temps to determine if your camber and tire pressures are optimized for the track surface.
- Suspension Travel: Use histograms to see if your springs and dampers are working within their optimal range.
FAQs
What is telemetry in sim racing?
Telemetry is the data recorded by the simulation software regarding car physics (speed, RPM, temps) and driver inputs (steering, throttle, braking). It is used to analyze performance and improve lap times.
Can telemetry really make me faster?
Yes. It removes the guesswork from driving. Instead of feeling like you are slow, telemetry shows you exactly which corner you are losing time in and why, such as braking too early or missing an apex.
Do I need expensive software to analyze my data?
While professional tools exist, many sim racers use accessible platforms like RaceData AI or built-in game tools to get clear, actionable insights without a steep learning curve.
How often should I check my telemetry?
It is best to check your data after a consistent stint of 5–10 laps. This ensures you are looking at your average pace rather than a one-off 'hero lap' or a lap with a significant mistake.